Filed under: 3D, Equipment, Lighting, On Location, photogrammetry, RTI | Tags: Maori weaving, photogrammetry, RTI, TeRa
In January 2020 Mark Mudge and I traveled to the British Museum in London to document the only existing Māori canoe sail of its kind, made over 200 years ago. The imaging work was performed in collaboration with the New Zealand project Te Rā – The Māori Sail Whakaarahia anō te rā kaihau! – Raise up again billowing sail! funded by The Royal Society – Te Apārangi Marsden Fund.
The New Zealand team produced a 13½-minute video of the project that you can watch here: Imaging Te Rā at the British Museum 2020

helps prepare the sail for imaging
The construction and materials of the last known Māori sail, Te Rā, had not been identified, documented, or made publicly available, until this project put significant efforts into these identifications and documentation. Māori textile researchers from New Zealand brought in CHI to image the sail, which is made with fragile plant materials and feathers. The CHI team used both photogrammetry and Reflectance Transformation Imaging (RTI) to help the experts examine and understand more about the delicately woven and perishable materials. The research team wanted to gain a greater understanding of how the Māori sailed the ocean and the intricacies of their weaving techniques.
We worked with the sail on site at the British Museum for 5 days.
The first day was all preparation: meeting the team, examining the sail, setting up equipment, testing lights, and troubleshooting. The second day was spent on the imaging. The initial preparation had begun back in the CHI studio in San Francisco, when Marlin Lum, Imaging Director, prepared for the intensive imaging project by creating a life-size paper template of the sail so the CHI team could work out the imaging logistics ahead of time. Marlin had also created an ingenious camera rig to manage the imaging and protect the fragile materials. Marlin’s rig was attached to a rental pro video slider unit that we picked up in London on the first morning.

At the museum collection facility, the sail was spread out on a protective foam core platform on the floor, covered by black paper. Because the sail has a pattern of holes in it, we performed tests on how best to mask out the holes so that they would be correctly modeled as holes in the final model. The black paper worked best. Over this the team positioned the trolley with its cantilevered arm that could move across and incrementally shoot the entire area, photo by photo. The camera height could be adjusted using a slider and the camera angle could be adjusted using a ball head.
Here is my project note from the morning of the second day:
“Light tests and light adjustments are done. We add a Speedlite to the mix of lights to deal with a corner that was a bit dark. We will trigger the Speedlite (Michael’s Canon 600) with the PocketWizard TT1 and TT5 combo and all 4 Monoblocks are set to slave mode. It takes a bit of time to tune everything in using the light meter and small adjustments. We feel now the entire sail is evenly lit and imaging can begin.”
Scale bars were placed around the small end of the sail as were color checkers. Using a Canon 5DSR with 24mm f2.8 IS USM lens, and shooting at 18 inches distance from the subject, the imaging began with a calibration pass with 90-landscape-270 rows – then returned to the 90 position for the remainder of the imaging in that pass.
The feathers that trim the sail presented a significant imaging challenge: they stick up, and there are knots and places where the material juts out. The camera focus was set manually to allow some extra depth of field above where the main body of the sail was laid out, so that these elements would remain in focus.
As the work progressed, I recorded this:
“We completed the second pass of the sail with a 50mm lens today and shot 3 RTIs of detail areas chosen by Donna from the Maori textile team. Then we had a crew come in to turn the sail over, and we prepped everything for the back side (which is actually more important for the weavers). We will begin shooting that first thing tomorrow.”

Image: © TeRa Project, Marsden Fund, 2020:
After completing the work on site each day, we returned to our London apartment and began the next step: processing the images of the sail. We have built the RTIs and some other high-resolution 2D outputs of the sail and shared them with the team. The detail is fantastic. We look forward to the team’s continued research and the publishing of their findings, along with our imaging results.

Special thanks to: Donna Campbell, co-Principle Investigator (co-PI) for the research project worked closely with us on site; Julie Adams, Curator of the Oceania Collections at the British Museum, hosted the imaging project; Michael O’Neill, a photographer from the National Museum of New Zealand Te Papa Tongarewa; Kira Zumkley, a London-based heritage photographer and researcher; and Jill Hassell, museum assistant. Catherine Smith, co-PI on the project aided in logistics and overall project management.
You can read more about the sail in the research team’s blog and also the British Museum’s description of the sail from its online collection.
Filed under: RTI, Training, Workshops | Tags: Digital Imaging, RTI, RTIViewer, Training, Workshops
 Marlin Lum is the Imaging Director at Cultural Heritage Imaging (CHI) and a member of the CHI training team.
I thought I’d take a few moments to decode what it’s like to be an instructor in one of our RTI training classes. Like anything else, there’s a certain level of planning, intention, and positive enthusiasm that I expect from myself (and from anyone enrolled). I do my best to pass this on to everyone who elects to give us their valuable time. I truly enjoy teaching at this level. I see these training sessions as a unique opportunity to pass on my knowledge in a form that can help create conditions primed for discoveries as well as to make new friends.
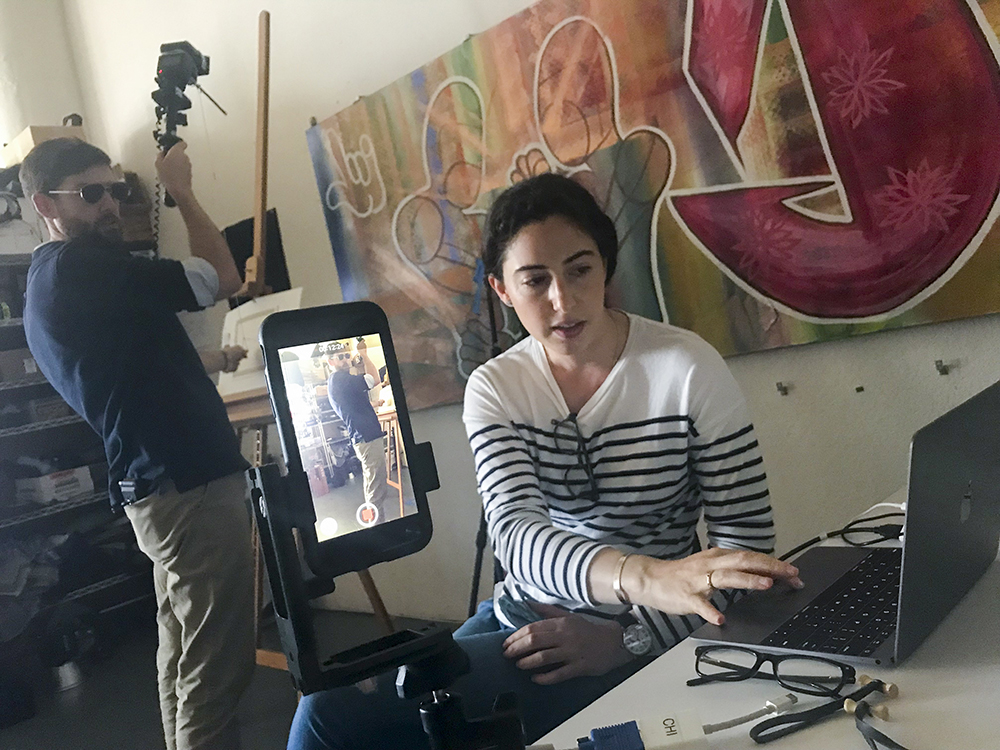
RTI capture with iPhone in tow to track one of those special photographic moments. (Aviator sun glasses optional.)
CHI RTI training (as well as our photogrammetry class) simply means spending four days conveying photo DIY geekiness to a usually very enthusiastic, and sometimes even rowdy, motley crew of professors, scholars, conservation professionals, archaeologists, and pro photographers. (By the way, just so you know, it’s usually the archaeologists and the pro shooters who can hold the most liquor.) All of these folks, and everyone who walks into one of our trainings, is ultra-talented, focused, and very motivated to succeed. As you might guess, this makes my job significantly easier as well as seemingly more important. At least the furious note-taking in most of my hands-on demos would lead me to think this. As I always state on day one, hour one: “I make it my goal to make you successful (at least photographically).”
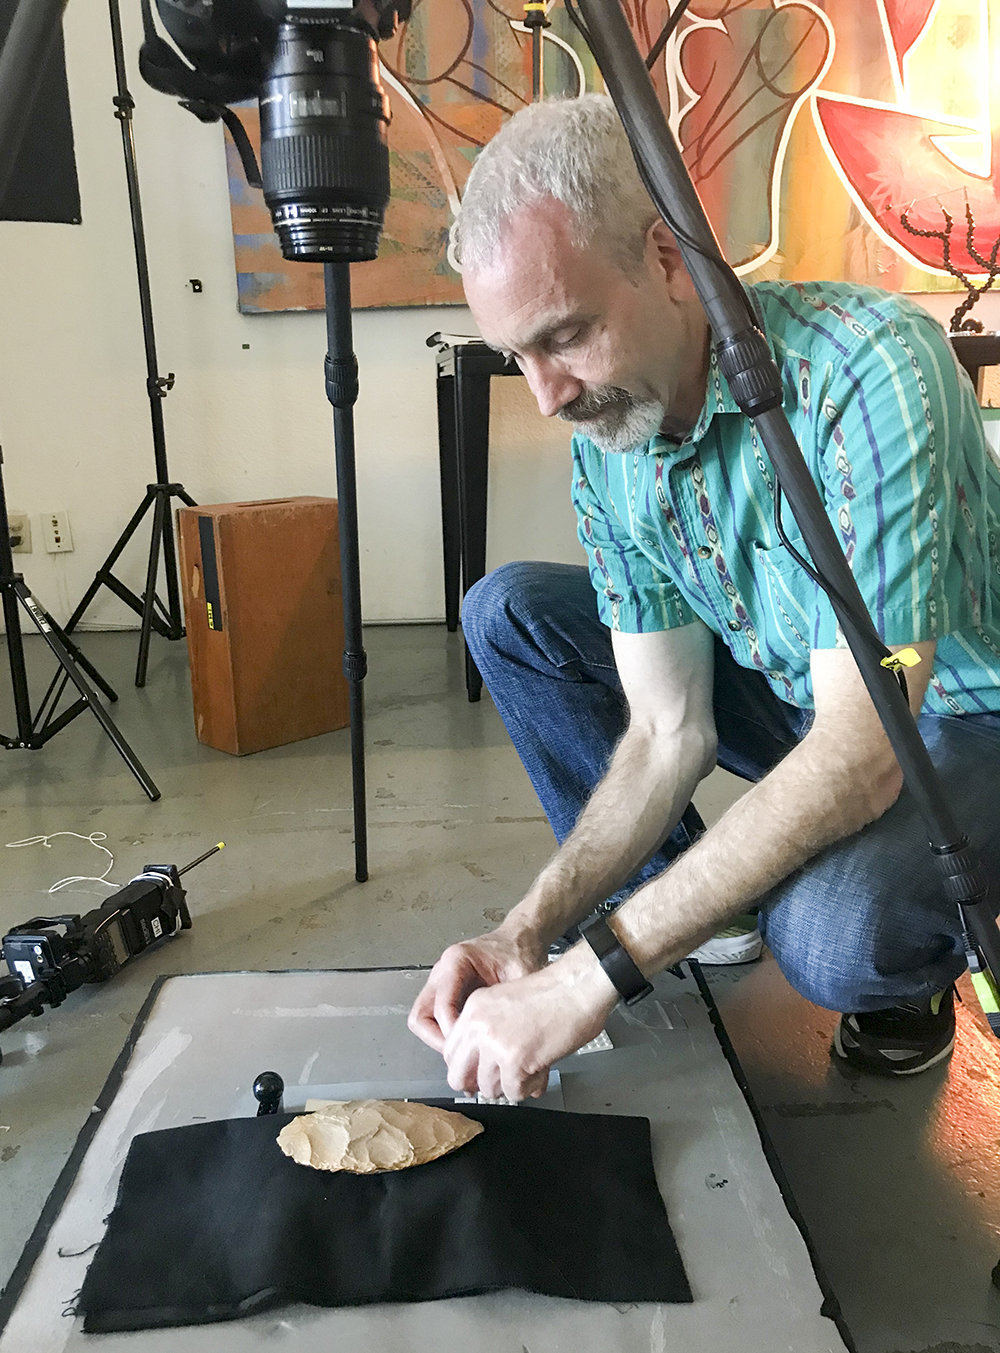
Got spheres? Get on the plane! Make sure those spheres are on same plane as the object. Place them carefully so they do not move and are always in focus.
Helping these trainees from the bus stop to the f-stop and along their way to making discoveries is not only a privilege but something of a rush. More than once I have witnessed the birth of an important discovery. I once watched a conservator realize that a Mayan lead ingot sitting on the bench actually had numerous coded “knot” inscriptions, though they were seemingly invisible to the human eye. RTI revealed this fairly matter of factly. I’ve heard the shriek of conservation staff as RTI revealed a previously hidden but somewhat “suspect” under-painting. I once heard an Egyptologist glyph expert read aloud, then carefully re-read, a good fortune spell. Apparently, the original person who had paid for the spell got taken, because RTI revealed that the original owner’s name had been scratched away and re-etched with a new dude’s name. I imagine that was a fairly common event. Wait till the guy dies, then sneak over there, scratch out his name, and write yours. Boom, check, all done, sweetie. All right there in stone — can’t deny that when the judge points a finger at you. The oohs and aahs I hear never disappoint.
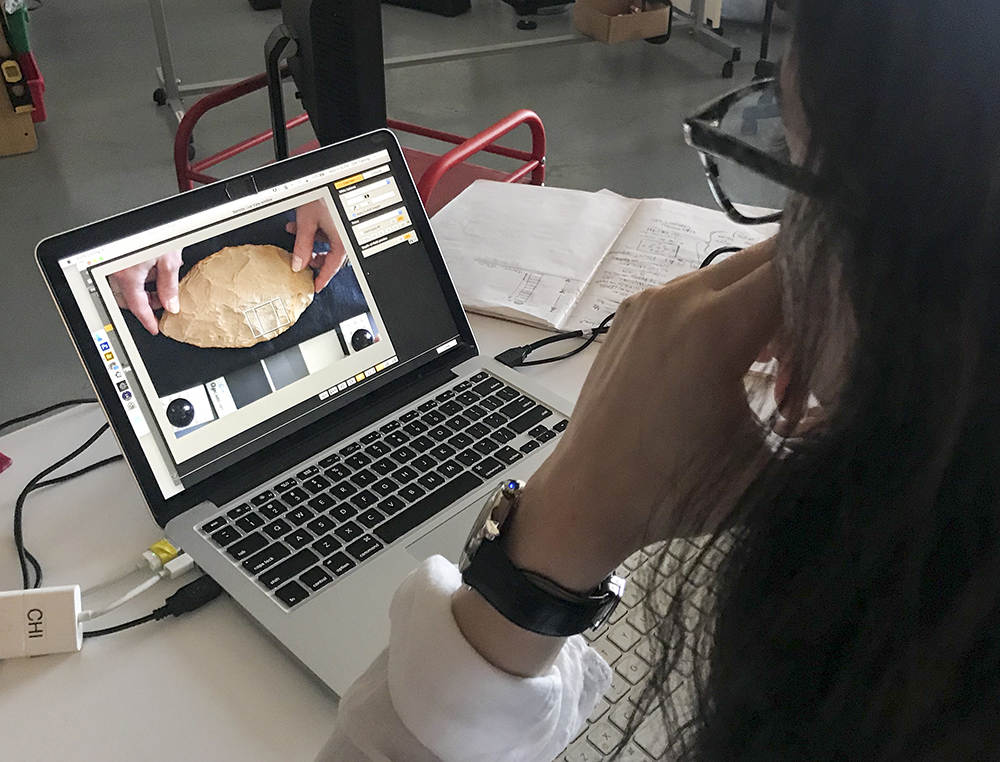
Setting up the object for proper RTI capture can take a bit of time, but using Live View mode can help your troubles go away.
Here’s the gist: I get fired up when I see you guys get fired up. RTI has the potential to inspire. Materials and objects that you didn’t think were worth imaging suddenly land on the request list. One down side: I heard a pro shooter from a large institution complain that he didn’t need any more work (oh, sorry).
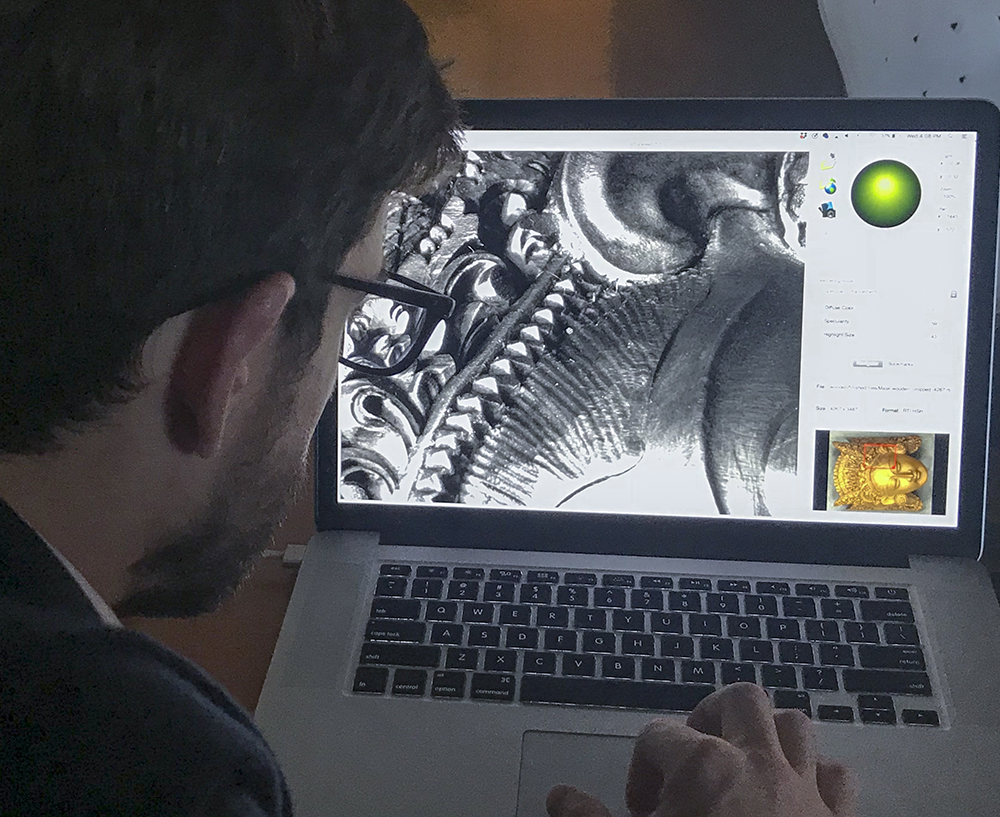
Use the RTIViewer to look at the details.
Just recently we taught an RTI class at the CHI studio (the photos in this blog are from that class). I’m not sure that any real discoveries were made, because we don’t have glyphs, ancient relics, masterpieces, or any “weird” non-provenance stuff from eBay lying around. However, I can vouch for the fact that I had a great time meeting cool new professionals, watching them engaged in what they do best, and then seeing them walk out the door, doing it better than before. Yup, I did write that. It’s in our best interest at CHI to make sure that you’re successful taking RTI (or photogrammetry) back to your professional crew.
Filed under: Conferences, Grants, Guest Blogger, Technology | Tags: 3D data, CHI, conservation, Digital Imaging, Digital Preservation, Open Source, RTI, symposium
Our guest blogger, Emily B. Frank, is currently pursuing a Joint MS in Conservation of Historic and Artistic Works and MA in History of Art at New York University, Institute of Fine Arts. Thank you, Emily!
With the National Endowment for the Humanities (NEH) back on the chopping block in the most recent federal budget proposal, I feel particularly privileged to have taken part in the NEH-funded symposium, Illumination of Material Culture, earlier this month.
Co-hosted by The Metropolitan Museum of Art and Cultural Heritage Imaging (CHI), the symposium brought together conservators, curators, archaeologists, imaging specialists, cultural heritage and museum photographers, and the gamut of engineers to discuss and debate uses, innovations, and limitations of computational imaging tools. This interdisciplinary audience fostered an environment for collaboration and progress, and a few themes emerged.

The sold-out crowd at the symposium at The Met
(1) The emphasis among practitioners seems to have shifted from isolated techniques to integrating a range of data types.
E. Keats Webb, Digital Imaging Specialist at the Smithsonian’s Museum Conservation Institute, presented “Practical Applications for Integrating Spectral and 3D Imaging,” the focus of which was capturing and processing broadband 3D data. Holly Rushmeier, Professor of Computer Science at Yale University, gave a talk entitled “Analyzing and Sharing Heterogeneous Data for Cultural Heritage Sites and Objects,” which focused on CHER-Ob, an open source platform developed at Yale to enhance the analysis, integration, and sharing of textual, 2D, 3D, and scientific data. CHI’s Mark Mudge presented a technique for the integrated capture of RTI and photogrammetric data. The theme of integration propagated through the panelists’ presentations and the lightning talks, including but not limited to presentations by Kathryn Piquette, Senior Research Consultant and Imaging Specialist at University College London, on the integration of broadband multispectral and RTI data; Nathan Matsuda, PhD Candidate and National Science Foundation Graduate Fellow at Northwestern University, on work at NU-ACCESS with photometric stereo and photogrammetry; as well as a lightning talk by Chantal Stein, in collaboration with Sebastian Heath, Professor of Digital Humanities at the Institute for the Study of the Ancient World; and myself, about the integration of photogrammetry, RTI, and multiband data into a single, interactive file in Blender, a free, open source 3D graphics and animation software.
(2) There is an emerging emphasis on big data and the possibilities of machine learning.

Paul Messier, art conservator and head of the Lens Media Lab at the Institute for the Preservation of Cultural Heritage, Yale University
The notion of machine learning and the possibilities it might unlock were addressed in multiple presentations, perhaps most notably in the “RTI: Beyond Relighting,” a panel discussion moderated by Paul Messier, Head of the Lens Media Lab, Institute for the Preservation of Cultural Heritage (IPCH), Yale University. Dale Kronkright presented work in progress at the Georgia O’Keeffe Museum in collaboration with NU-ACCESS that utilizes algorithms to track change to the surfaces of paintings, focusing on the dimensional change of metal soaps. Paul Messier briefly described the work being done at Yale to explore the possibilities for machine learning to work iteratively with connoisseurs to push data-driven research forward.

Mark Mudge, President of CHI, participates in a panel discussion
(3) The development of open tools for sharing and presenting computational data via the web and social media is catching up.
Graeme Earl, Director of Enterprise and Impact (Humanities) and Professor of Digital Humanities at the University of Southampton, UK, gave a keynote entitled “Open Scholarship, RTI-style: Museological and Archaeological Potential of Open Tools, Training, and Data,” which kicked off the discussion about open tools and where the future is heading. Szymon Rusinkiewicz, Professor of Computer Science at Princeton University, presented “Modeling the Past for Scholars and the Public,” a case study of a cross-listed Archaeology-Computer Science course given at Princeton in which students generated teaching tools and web content that provided curatorial narrative for visitors to the museum. CHI’s Carla Schroer presented new tools for collecting and managing metadata for computational photography. Roberto Scopigno, Research Director of the Visual Computing Lab, Consiglio Nazionale delle Richerche (CNR), Istituto di Scienza e Tecnologie dell’Informazione (ISTI), Pisa, Italy, delivered the keynote on the second day of the symposium about 3DHOP, a new web presentation and collaboration tools for computational data.
We had the privilege of hearing from Tom Malzbender, without whose work at HP Labs in the early 2000s this symposium would never have happened.
The keynotes at the symposium were streamed through The Met’s Facebook page. The other talks were recorded and will be available in three to four weeks. Enjoy!

Tom Malzbender, the inventor of RTI, at the podium
Filed under: Guest Blogger, On Location, Technology | Tags: Archaeology, biofilm removal, bronze, Lydia, Roman, RTI, Sardis
Our guest blogger, Emily B. Frank, is a student conservator on the Sardis Archaeological Expedition. Currently she is pursuing a Joint MS in Conservation of Historic and Artistic Works and MA in History of Art at New York University, Institute of Fine Arts. Thank you, Emily!
Sardis, the capital city of the Lydian empire in the seventh and sixth centuries BC, is often best remembered for the invention of coinage. Remains of a monumental temple of Artemis, begun during the Hellenistic period and never finished, still stand tall today. In Roman times, the city was famous as one of the Seven Churches of Asia in the Book of Revelation. In the fourth and fifth centuries AD, Sardis boasted what is still the largest known synagogue in antiquity. Sardis flourished and continued to grow in the Late Roman period until its decline by the seventh century AD.
Archaeological excavations at Sardis began over a century ago and are currently led by Dr. Nicholas D. Cahill, professor of Art History at the University of Wisconsin, Madison. The excavated material is vastly diverse and the conservation efforts there equally so. Conservation this season, under Harral DeBauche, a third-year conservation student at New York University, Institute of Fine Arts, supported active excavation across over 1,000 years of antiquity and addressed a number of site preservation issues. RTI greatly benefited the conservators and archaeologists in a couple of significant ways.
Significant finds with extremely shallow incised designs/inscriptions and impressions were made legible with RTI. RTI was helpful in understanding a bronze triangle recovered from the corridor of a Late Roman house (Fig. 1).

Figure 1: H-RTI setup used for small objects at Sardis.
The triangle is incised with three images of a female deity and a border of magical signs (Fig. 2). Its use is likely connected with religious ritual practice in Asia Minor between the third and sixth centuries AD.

Figure 2: RTI of the bronze triangle in cumulative unsharp masking viewing mode.
The legibility of the inscriptions, aided by RTI, reinforced the connection between the triangle’s inscriptions and material and written sources. Two comparenda for the triangle, one from Pergamon and one from Apamea, were identified, and the magic symbols on the triangle were connected with rituals described in a the Greek Magical Papyri. RTI also aided in decoding and documenting a lead curse tablet and in understanding the weave structure of bitumen basketry impressions.
Additionally, a multi-year biofilm removal project of the Artemis Temple at Sardis is currently underway, headed by Michael Morris and Hiroko Kariya, conservators in private practice. The removal of this biofilm is carried out by a six-day process. RTI was used experimentally to document the changes to the stone throughout the removal process (Fig. 3).

Figure 3: H-RTI setup used for documentation of the biocide removal project.
RTIs were taken before treatment, during treatment (day 3), and after treatment (day 7). Because the biocide continues to work for months after its application, a final RTI will be taken next summer. Initial comparison of the images showed no loss to the stone surface as a result of the biofilm removal process. All very exciting!
To find out more about the excavations at Sardis, see http://sardisexpedition.org/.
Filed under: Guest Blogger, On Location | Tags: Archaeology, knapped tools, lithics, RTI
This is the second post by our guest blogger Dr. Leszek Pawlowicz, an Associate Practitioner in the Department of Anthropology, Northern Arizona University, Flagstaff, AZ, USA. He can be contacted at leszek.pawlowicz@nau.edu. Thank you again, Leszek! Even in the age of digital photography, archaeology still relies heavily on old-school hand-drawn illustrations for documenting artifacts, particularly for publication. It can be difficult, or even impossible, to get a single photograph that shows all of the artifact’s key details. In my area of interest, knapped stone tools, low relief in small-scale surface topography, high relief in large-scale topography, specular (reflective) materials, variations in material color and contrast across the surface, all conspire to make these artifacts difficult to photograph. A skilled illustrator is capable of creating a drawing that reveals far more detail than even a good standard photograph (Figure 1). But creating such a drawing requires experience, time, and money, often making it impractical.

Figure 1: Comparison of digital photograph and line drawing of knapped stone tool. Courtesy Lance Trask, http://lktrask-media.com/.
Reflectance Transformation Imaging (RTI) is a great way to document and image knapped stone tools. The ability to interactively modify the lighting angle, as well as mathematically manipulate the perceived interaction of light and surface, allows the viewer to see details difficult to photograph. It’s almost the equivalent of having the object in your hands, and turning it at various angles to the light to reveal details of its structure and manufacture. However, one drawback is that you can’t embed an RTI view in a paper or publication unless it’s in electronic format. Also, unlike a drawing that can show all the critical details at once, you may have to move the virtual lighting angle in many different directions to reveal all details. Using data from the custom RTI systems I described in a previous post, I’ve been working on ways to create static images of knapped stone tools with detail comparable to that in a line drawing.

Figure 2: Modern obsidian knapped point. A – Original digital photograph; B – Static RTI view; C- RTI Specular mode; D – RTI Static Multilight mode; E – RTI Normals mode; F – Enhanced RTI Normals mode. Click on image for enlarged view.
Figure 2 shows a series of images of a modern knapped projectile point fashioned from specular black obsidian, a particularly difficult material to photograph because of its shininess and lack of contrast. 2-A is an original digital photograph, with the lighting coming from the standard upper left direction; while a fair amount of detail is visible, shiny highlights obscure some details, and the overall convex shape of the point interferes with lighting on the right side of the point. 2-B shows an RTI view with lighting from the upper left; while glossy highlights have been eliminated, and more detail is visible on the right, other details are somewhat more subdued in this static view. Figure 2-C uses the RTI specular viewing mode, which imparts an artificially shiny character to the surface. This is actually a superior result for this mode on knapped stone tools – most of the time, it doesn’t look nearly this good (as you’ll see shortly). But this image suffers from lack of detail in some areas, probably because of the artifact’s overall convex surface shape. Figure 2-D uses the RTI Static Multilight mode, where the RTI data is analyzed to determine the optimal blend of multiple light angles to reveal details. Once again, this is a better result than I usually get for knapped stone tools, but some details are still hard to see because of lack of contrast in many areas. Overall, I have found that the recently added RTI Normals viewing mode leads to the best results. This mode color-codes the surface based on the perpendicular direction at every point in the image. Figure 2-E was generated using the Normals mode and a second-order HSH RTI file (standard Polynomial Texture Mapping or PTM) files produce markedly poorer results). Even in the raw colored state, the amount of detail visible across the entire surface is vastly superior to the other views. Using standard image enhancement techniques, one can further process this image to generate an extremely detailed view of the artifact’s surface details (Figure 2-F). While this modern artifact was made of a difficult material, the freshness of manufacture, lack of wear, and non-exposure to the elements make the surface features quite sharp and easy to see. What about an actual prehistoric point with a real history?

Figure 3: Molina Spring Clovis point. A – Original digital photograph; B – Static RTI view; C- RTI Specular mode; D – RTI Static Multilight mode; E – RTI Normals mode; F – Enhanced RTI Normals mode; G – Slope-shaded mode. Click on image for enlarged view.
Figure 3 shows a series of similar photographs for the Molina Spring Clovis point, collected about 10 years ago in the Apache-Sitgreaves National Forest. Clovis points are approximately 13,500 years old; this one in particular has seen a lot of wear on the flake scars, making them difficult to make out. What’s more, the point’s material (chert) is slightly glossy and very light in color, minimizing contrast in surface details. Figures 3-A through 3-F show the same image processing sequence as Figures 2-A through 2-F; note in particular that the Specular and Static Multilight modes (3-C and 3-D) do not produce especially useful images for this point. The raw Normals image (3-E) brings up details difficult to impossible to spot in the previous images, and enhancing the Normals image (3-F) makes those details even easier to see. For Figure 3-G, a Matlab script was used generate a modified view based on slope; this brings out certain details not immediately visible in the original normals image. In my opinion, images like 3-F and 3-G are superior to standard digital photographs of knapped stone tools and could well be used instead of line drawings for publication purposes. Even in cases where line drawings are preferred, these images could provide a useful background basis for tracing artifact details, instead of drawing them freehand. Beyond static images, the normals data can be used to generate a full 3D representation of the artifact’s surface. Some examples of this are visible at my website, along with downloadable 3D files and RTI data files for several projectile points. The 3D surfaces aren’t yet fully accurate, as they can be affected by inaccuracies in the normals calculation, and error accumulations in the surface fitting. However, these results are already significantly improved from my initial efforts, and I will be working on improving them further. Even in the current form, I believe that it should be possible to extract usable information than can be used to quantitatively characterize knapped stone tools.
Filed under: Equipment, Guest Blogger, On Location | Tags: Archaeology, canon, capture, dome, guest blogger, lighting array, lithics, Reflectance Transformation Imaging, RTI, stone tools
Our guest blogger is Dr. Leszek Pawlowicz, an Associate Practitioner in the Department of Anthropology, Northern Arizona University, Flagstaff, AZ, USA. He can be contacted at leszek.pawlowicz@nau.edu. A longer version of this post can be seen at http://rtimage.us/?page_id=27. Thank you, Leszek!
When I learned about Reflectance Transformation Imaging (RTI) back in 2009, one of my first thoughts was that it could be a useful tool for imaging and analyzing lithic archaeological artifacts, flaked stone tools in particular. Not an original thought even back then, and over the next four years I’ve seen the occasional RTI lithic image pop up on the web, demonstrating how useful RTI could be in this application. Early in 2013, I started experimenting with RTI on some modern replica projectile points using Highlight-RTI method. Though I got usable results with these experiments, I decided that Dome-RTI was a more appropriate method because of the reduced data acquisition and processing times.
So began a two-year process of building my first Dome-RTI system and refining it. After multiple iterations of the lighting system, controller, and camera/dome stand, I wound up with an 18″-diameter acrylic dome that produces excellent results and is useful for RTI on larger artifacts. However, it’s grossly over-sized for most of the artifacts I’m interested in documenting. Most flaked stone lithic artifacts in the American Southwest are less than 3 inches in length, and an 18″ dome is easily capable of imaging artifacts of at least 4.5″ in maximum dimension (I’ve gotten useful results on artifacts up to 6″ in length). What’s more, these artifacts are housed in scattered locations (museums, government facilities, universities, etc.), and the large size of the dome and stand make transportation and setup of this big system cumbersome. So, applying lessons learned from the first system, I built a second system with an emphasis on portability and speed (Figure 1):

Figure 1: Portable RTI dome
- Dome diameter is 12″, and sits on a stand that is 13.5″ square; total weight of the dome + stand + camera is less than 4 kg. The small size lets it fit into a Pelican case for easy transport.
- The controller box automatically lights 48 3W LEDs in sequence for the light sources; maximum current is 1 amp, and can be set as low as 150 milliamps. The camera shutter is triggered automatically in sync with the LEDs using either a wired remote cable, an IR remote signal, or a Bluetooth HID transmitter; a manual shutter mode is also available.
- Data acquisition time is about 3 minutes with a Canon S110 camera (12 MP, native 12-bit RAW), about one minute with Canon/Nikon DSLRs. A custom GUI front-end for the PTM and HSH fitters reduces data processing time to 1-3 minutes after the photographs are transferred to a computer.
- Dome is mounted on a hinged stand, which allows artifacts to be swapped in/out in about 10 seconds.
- Entire system is powered by 9-12V DC, either from a wall transformer or appropriate battery power supply.
The system can fit securely in a standard camping backpack with room to spare, with a total weight of less than 5 kg. The option of battery power makes this a truly portable, field-ready RTI system (Figure 2).

Figure 2: Portable RTI Dome “in the field,” north of San Francisco Peaks, Flagstaff, Arizona
When recording archaeological sites out in the field, it is often not possible to collect lithic artifacts to bring back to the lab for proper documentation. You either have to photograph them in the field (usually with less-than-satisfactory resolution of artifact details), or hand-draw the flake scars (a slow and tedious process, and often highly inaccurate). This portable RTI system makes it possible to thoroughly document lithic artifacts on-site.
This system has a few more tricks up its sleeve. Full analysis of a lithic artifact may require microscopic analysis of edgewear to determine how it was used.

Figure 3: Dome in microphotography mode with USB microscope
A simple reconfiguration of the system (Figure 3) allows high-magnification RTI imaging of lithic artifacts, using either the USB microscope (as pictured), or a DSLR equipped with a macro lens that has a working distance of 6″ or more (roughly 90-100mm focal length). A micrometer stage allows for accurate positioning of the artifact under the microscope.
You can also reconfigure the stand to mount the dome vertically for imaging larger artifacts. While I plan to use it in this mode to image the surface of Southwestern pottery, Figure 4 shows the system in vertical mode being used to image an oil painting.

Figure 4: Dome in vertical mode, imaging an oil painting
The normals may be off a bit because of the increased spacing between dome and painting, but you can still get useful results, like the specular mode image shown in Figure 5.

Figure 5: RTI specular image of painting surface shot in vertical mode
Total parts cost of this portable RTI dome, including the Canon camera, was well under $800. Scaling the dome up to a higher size would increase the expenditure by only the extra cost of the dome plus additional LEDs if desired (e.g. 64 instead of 48). For example, a one-meter dome with 64 LEDs would add approximately $400 to the total cost. In the near future, I hope to post information/instructions online that would allow anyone to build a system of their own. If I can build a system without instructions, I’m sure many others could easily build such a system with instructions.
In an upcoming post, I’ll present some of my lithics RTI imaging results from both of my Dome-RTI systems.
Filed under: Commentary, News | Tags: Anna Ressman, cultural heritage imaging, Digital Imaging, Oriental Institute Museum, Reflectance Transformation Imaging, RTI, Technology, University of Chicago, visualization
Recently Anna R. Ressman, Head of Photography at the Oriental Institute Museum, University of Chicago, shared a compelling article with me, and now I’m sharing it with you.
Here is a link to the Oriental Institute newsletter (PDF), which contains the article entitled, “Behind the Scenes: Museum Photography at the Oriental Institute.”
Anna describes the process in which five very different artifacts are documented, each with a unique challenge. And yes, you guessed it, one of those artifacts was documented using the RTI highlight method.
Documentation of the Egyptian stele “was photographed with a method of computational photography called Reflectance Transformation Imaging (RTI).”

Using RTI to photograph OIM E14655 with photo assistants K. Bryce Lowry and Austin M. Kramer

OIM E14655, Egyptian Stele, Limestone, New Kingdom, Medinet Habu, Egypt. 36x26cm

Specular enhancement using RTI of Egyptian Stele OIM E14655
Anna concludes the section on RTI with these insights: “RTI files can be created in such a manner that pixel data is analyzed to show specular information rather than color data, which can reveal more information about the surface of the object than color data alone (figs. 3–4). As you can see, the inscriptions on the stele are much clearer in the specular-enhancement PTM image (fig. 3), even though the studio photograph (fig. 4) was taken using a macro lens under controlled studio lighting. The former may not be as aesthetically pleasing as the latter, but it reveals much more information than would normally be seen — and that is just a single image out of a series of forty-five.”
Be sure to download the complete article and check out the rest of the newsletter as well.
Anna R. Ressman is Head of Photography at the Oriental Institute Museum, University of Chicago, USA. Anna is also a freelance photographer and a fine artist.
[Photos by Anna R. Ressman/Courtesy Oriental Institute Museum, University of Chicago]
Filed under: News, Technology | Tags: 3D laser scanning confocal microscopy, Attic pottery, Contour line, Greek, Greek vase, Magna Graecia, Red-figure vase, red-figure vases, Reflectance transformation imaging (RTI), relief line, RTI, Vase painting

Paula Artal-Isbrand and Philip Klausmeyer recently published an article in the Studies in Conservation journal.
Entitled “Evaluation of the relief line and the contour line on Greek red-figure vases using reflectance transformation imaging and three-dimensional laser scanning confocal microscopy,” the article examines “…the relief and contour lines on a group of ancient Greek red-figure vases and vase fragments.”
Paula and Philip, both of the Worcester Art Museum in Worcester, Massachusetts, USA, describe how they deployed “… two surface examination methods – reflectance transformation imaging and three-dimensional laser scanning confocal microscopy” to “… characterize the lines and answer questions regarding tools, techniques, and production sequence used by Greek vase painters.”
Their work is interesting and empirical, with numerous examples that yield detailed observations about the tools and techniques used to create the decorative features on vases and vase fragments, with a particular emphasis on relief and contour lines.
Download the entire PDF:
Filed under: Commentary, News, Technology | Tags: Antikythera Mechanism, PTM, RTI

Tom Malzbender imaging a piece from the Antikythera Mechanism
We are absolutely thrilled to announce that Tom Malzbender has joined the Cultural Heritage Imaging Board of Directors!
Tom is a long-time friend of CHI and has been an adviser and collaborator on many projects. Tom is best known as the co-inventor (with Dan Gelb) of Polynomial Texture Mapping (PTM) in 2001 while he was at HP Labs. PTM is the first form of Reflectance Transformation Imaging (RTI).
Tom has had a long research career in the fields of computer graphics and computer vision as demonstrated by his many published papers. He has frequently applied this work to cultural heritage material, most notably as part of the team that deciphered the Antikythera Mechanism. This groundbreaking work was featured in the NOVA documentary “Ancient Computer”
Welcome Tom!
On August 16, 2002 we founded Cultural Heritage Imaging as a nonprofit corporation in San Francisco. Wow, it seems like yesterday and it seems like a long time ago! Our digital camera at that time was 3 megapixels and it had a pretty slow auto focus. We had seen Tom Malzbender’s pioneering Polynomial Texture Mapping paper at SIGGRAPH in 2001, and we began working with him several weeks later. However, using the technique required working with command-line software and capturing images using either a lighting array (dome) or a very time consuming detailed template approach.

CHI’s manual RTI rig – 2004
We were shooting some 3D using structured light software from Eyetronics, and we had been on site with Professor Patrick Hunt of Stanford University at his archeological excavation at the Grand St. Bernard Pass in Switzerland as early as 2001.

Mark Mudge, Carla Schroer, and Marlin Lum on location at the Grand St. Bernard Pass in August 2004
We have come a long way since then, working with numerous museums, historic sites, archaeologists and historians, as well as computer science researchers. In 2006 we developed (with Tom Malzbender) the Highlight RTI technique, and we worked with the team at the University of Minho in Portugal to develop open source software to support that (RTIBuilder). With a grant from the Institute of Museum and Library Services beginning in 2006, we researched a multi-view approach to RTI and out of that collaboration with Professor James Davis et. al. of UC Santa Cruz and the Visual Computing Lab in Pisa came the open source Hemispherical Harmonics fitter (section 6 in the tutorial notes) and the RTIViewer.
Also in 2006 we were contacted by folks at the Worcester Art Museum Conservation Lab interested in using RTI for art conservation. After a small pilot project, we built a light array for them and trained them in the RTI technique. To this day we appreciate this group, their vision of how this technology could be used regularly in their field, and their willingness to go out on a limb to make to make it happen and share their work with others.

Worcester Art Museum Conservation Lab – May 2008
In 2008, as interest in RTI grew on the part of museums and historic sites, CHI made a great effort to develop training programs for RTI and other computational photography techniques. We have since trained over 200 people in our full 4 day RTI class, and we have introduced hundreds more to RTI through workshops and presentations at numerous conferences and lecture series.
Our current research work includes an NSF funded project with Professor Szymon Rusinkiewicz of Princeton University to further develop the technique of Algorithmic Rendering with RTI data sets and easy-to-use software that includes a way to keep track of the full process history in a digital lab notebook. We began working on the requirements and methodology for how to manage this process history for all of our imaging work and especially RTI back in 2002, and we shared it with the computer graphics community in 2004 on a SIGGRAPH panel called “Computer Graphics and Cultural Heritage: What are the Issues?” chaired by professor Holly Rushmeier. Our early work referred to this subject as “empirical provenance,” described in detail in this 2007 paper delivered at the CIPA conference.
So now, 11 cameras, many well-worn travel bags, and I can’t even count how many laptops later, we enter our second decade of collaboration with many wonderful people from all over the planet. We thank some of the folks who have helped us along the way on our acknowledgments web page but it isn’t and can’t possibly be a complete list. CHI was founded on the principles of collaboration and the democratization of technology, producing tools and methodology that enhance scientific reliability and long-term preservation.
We would like to say thank-you to everyone who has volunteered time, donated money or equipment, shared their work, asked us questions, answered our questions, written down how to do things, listened to us speak, formed project collaborations, or run across our path in some interesting way! We hope to meet you all again, and many others down the road.
Cheers!
