Filed under: Equipment, Guest Blogger, photogrammetry, Technology, Training, Workshops
Christopher Ciccone is a photographer at the North Carolina Museum of Art, and this is a post he wrote for the museum’s blog Circa. Chris attended the 4-day photogrammetry training class taught by the CHI team at the museum in May 2018 and describes the experience here. Thank you for sharing your blog, Chris!
Photogrammetry is the science of making measurements from photographs of an object (or in aerial photogrammetry, a geographic area). This is done by taking a series of carefully plotted still photographs that incorporate targets of known size and then analyzing the images with specialized software. The resulting data can then be used to generate a variety of output products such as maps, detailed renderings, and 3-D models for use in a number of applications.

Dense point cloud rendering of sculptor William Artis’s Michael. The blue rectangles represent the position of the camera for each image that was used to create the 3-D model.
Although photogrammetry as a scientific measurement technique has existed since the nineteenth century, it has been the advent of digital photography and high-powered computational capacity that has made it a practical tool for scholars, researchers, and photographers. Because photogrammetry can be employed on objects of any size, its usefulness in the cultural heritage sector is vast. Interesting uses of photogrammetry include, for example, documentation of historic sites that might be slated for destruction or are in danger of ongoing environmental damage.

Workshop participants in the NCMA Park photograph various angles of Ledelle Moe’s Collapse.
Photogrammetry at the NCMA
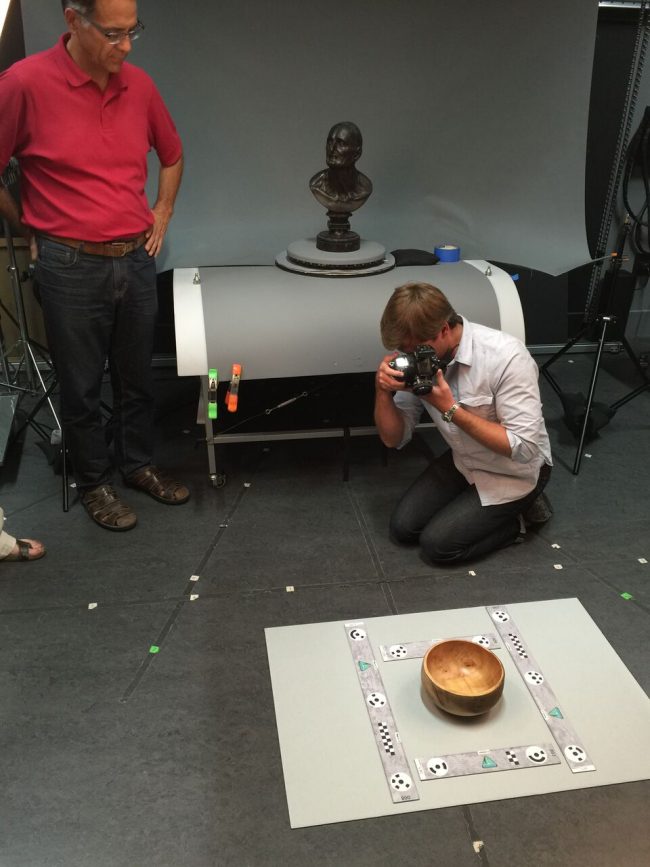
In May the Musem’s Photography and Conservation departments hosted instructors Carla Schroer and Mark Mudge from Cultural Heritage Imaging in San Francisco for a four-day photogrammetry training workshop. Participants included myself, NCMA Head Photographer Karen Malinofski, and NCMA objects conservator Corey Riley, as well as colleagues from the National Park Service and the University of Virginia.

Workshop participants Cari Goetcheus and Gregory Luna Golya photograph Willam Artis’s Michael on a turntable to facilitate views from all angles of the object.

William Ellisworth Artis, Michael, mid-to-late 1940s, H. 10 1/4 x W. 6 x D. 8 in., terracotta, Purchased with funds from the National Endowment for the Arts and the North Carolina State Art Society (Robert F. Phifer Bequest)
In the course of the class, we photographed several artworks in the Museum’s permanent collection, from a small bust by William Artis to Ledelle Moe’s monumental outdoor sculpture Collapse. The technique consisted of taking “rings” of overlapping photographs around the object, at optimal distance relative to focal length, with camera lenses set at a fixed focus point and aperture. The primary objective in each case was to establish a consistent, rule-based workflow in order to reduce the measurement uncertainty of the rendered photoset, which may then be used to generate reliable 3-D data as well as be archived and used for further study by others.
At the NCMA we plan to employ the technique for such projects as monitoring the surface wear over time of our outdoor sculptures, revealing surface markings of ancient objects for insight into makers’ techniques and tools, and generating 3-D renderings of delicate artifacts that can be manipulated and viewed in virtual environments by museum visitors and scholars. Other applications will become possible as 3-D processing tools are improved.

Will Rourk of the University of Virginia and NCMA Head Photographer Karen Malinofski photograph details of Collapse.

Christopher Ciccone is a photographer at the North Carolina Museum of Art.
Filed under: Conferences, Grants, Guest Blogger, Technology | Tags: 3D data, CHI, conservation, Digital Imaging, Digital Preservation, Open Source, RTI, symposium
Our guest blogger, Emily B. Frank, is currently pursuing a Joint MS in Conservation of Historic and Artistic Works and MA in History of Art at New York University, Institute of Fine Arts. Thank you, Emily!
With the National Endowment for the Humanities (NEH) back on the chopping block in the most recent federal budget proposal, I feel particularly privileged to have taken part in the NEH-funded symposium, Illumination of Material Culture, earlier this month.
Co-hosted by The Metropolitan Museum of Art and Cultural Heritage Imaging (CHI), the symposium brought together conservators, curators, archaeologists, imaging specialists, cultural heritage and museum photographers, and the gamut of engineers to discuss and debate uses, innovations, and limitations of computational imaging tools. This interdisciplinary audience fostered an environment for collaboration and progress, and a few themes emerged.

The sold-out crowd at the symposium at The Met
(1) The emphasis among practitioners seems to have shifted from isolated techniques to integrating a range of data types.
E. Keats Webb, Digital Imaging Specialist at the Smithsonian’s Museum Conservation Institute, presented “Practical Applications for Integrating Spectral and 3D Imaging,” the focus of which was capturing and processing broadband 3D data. Holly Rushmeier, Professor of Computer Science at Yale University, gave a talk entitled “Analyzing and Sharing Heterogeneous Data for Cultural Heritage Sites and Objects,” which focused on CHER-Ob, an open source platform developed at Yale to enhance the analysis, integration, and sharing of textual, 2D, 3D, and scientific data. CHI’s Mark Mudge presented a technique for the integrated capture of RTI and photogrammetric data. The theme of integration propagated through the panelists’ presentations and the lightning talks, including but not limited to presentations by Kathryn Piquette, Senior Research Consultant and Imaging Specialist at University College London, on the integration of broadband multispectral and RTI data; Nathan Matsuda, PhD Candidate and National Science Foundation Graduate Fellow at Northwestern University, on work at NU-ACCESS with photometric stereo and photogrammetry; as well as a lightning talk by Chantal Stein, in collaboration with Sebastian Heath, Professor of Digital Humanities at the Institute for the Study of the Ancient World; and myself, about the integration of photogrammetry, RTI, and multiband data into a single, interactive file in Blender, a free, open source 3D graphics and animation software.
(2) There is an emerging emphasis on big data and the possibilities of machine learning.

Paul Messier, art conservator and head of the Lens Media Lab at the Institute for the Preservation of Cultural Heritage, Yale University
The notion of machine learning and the possibilities it might unlock were addressed in multiple presentations, perhaps most notably in the “RTI: Beyond Relighting,” a panel discussion moderated by Paul Messier, Head of the Lens Media Lab, Institute for the Preservation of Cultural Heritage (IPCH), Yale University. Dale Kronkright presented work in progress at the Georgia O’Keeffe Museum in collaboration with NU-ACCESS that utilizes algorithms to track change to the surfaces of paintings, focusing on the dimensional change of metal soaps. Paul Messier briefly described the work being done at Yale to explore the possibilities for machine learning to work iteratively with connoisseurs to push data-driven research forward.

Mark Mudge, President of CHI, participates in a panel discussion
(3) The development of open tools for sharing and presenting computational data via the web and social media is catching up.
Graeme Earl, Director of Enterprise and Impact (Humanities) and Professor of Digital Humanities at the University of Southampton, UK, gave a keynote entitled “Open Scholarship, RTI-style: Museological and Archaeological Potential of Open Tools, Training, and Data,” which kicked off the discussion about open tools and where the future is heading. Szymon Rusinkiewicz, Professor of Computer Science at Princeton University, presented “Modeling the Past for Scholars and the Public,” a case study of a cross-listed Archaeology-Computer Science course given at Princeton in which students generated teaching tools and web content that provided curatorial narrative for visitors to the museum. CHI’s Carla Schroer presented new tools for collecting and managing metadata for computational photography. Roberto Scopigno, Research Director of the Visual Computing Lab, Consiglio Nazionale delle Richerche (CNR), Istituto di Scienza e Tecnologie dell’Informazione (ISTI), Pisa, Italy, delivered the keynote on the second day of the symposium about 3DHOP, a new web presentation and collaboration tools for computational data.
We had the privilege of hearing from Tom Malzbender, without whose work at HP Labs in the early 2000s this symposium would never have happened.
The keynotes at the symposium were streamed through The Met’s Facebook page. The other talks were recorded and will be available in three to four weeks. Enjoy!

Tom Malzbender, the inventor of RTI, at the podium
Filed under: Guest Blogger, Technology, Training, Workshops | Tags: 3D data, conservation, photogrammetry, Training
Lauren Fair is Associate Objects Conservator at Winterthur Museum, Garden, & Library in Buffalo, New York. She also serves as Assistant Affiliated Faculty for the Winterthur/University of Delaware Program in Art Conservation (WUDPAC). Lauren was a participant in CHI’s NEH grant-sponsored 4-day training class in photogrammetry, August 8-11, 2016 at Buffalo State College. She posted an account of her experience in the class in her own blog, “A Conservation Affair.” Here is an excerpt from her fine post.
 I have discovered the perfect way to decompress after a four-day intensive seminar on 3D photogrammetry: go to your friend’s cabin on a small island in a remote part of Canada. While you take in the fresh air and quiet of nature, you can then reflect on all that you have shoved into your brain in the past week – and feel pretty good about it!
The Cultural Heritage Imaging (CHI) team – Mark, Carla, and Marlin – have done it again, in that they have taken their brilliance and passion for photography, cultural heritage, and documentation technologies, and formulated a successful workshop on 3D photogrammetry that effectively passes on their expertise and “best practice” methodologies.
The course was made possible by a Preservation and Access Education and Training grant awarded to CHI by the National Endowment for the Humanities.
(Read the rest of Lauren’s blog here.)
This blog by Carla Schroer, Director at Cultural Heritage Imaging, was first posted on the blog site, Center for the Future of Museums, founded by Elizabeth Merritt as an initiative of the American Alliance of Museums.
My organization, Cultural Heritage Imaging (CHI), has been involved in the development of open source software for over a decade. We also use open source software developed by others, as well as commercial software.
What drove us to make our work open for other people to use and adapt?
We are a small, independent nonprofit with a mission to advance the state of the art of digital capture and documentation of the world’s cultural, historic, and artistic treasures. Development of technology is only one piece of our work–we are involved in many aspects of scientific imaging, including developing methodology, training museum and heritage professionals, and engaging in imaging projects and research. Because we are small, and because the best ideas and most interesting breakthroughs can happen anywhere, we collaborate with others who share our interests and who have expertise in using digital cameras to collect empirical data about the real world.
Our choice to use an open source license with the technology that is produced in this kind of collaboration serves both the organizations involved in its development and the adopters of the software. By agreeing to an open source license, the people and institutions that contribute to the software development are assured that the software will be available and that they and others can use it and modify it now and in the future. It also keeps things fair among the collaborators, ensuring that no one group exploits the joint work.
How does open source benefit its users?
It’s beneficial not just because the software is free. There is a lot of free software that is distributed only in the “executable” version without making the source code available to others to use and modify. One advantage to users who care about the longevity of their data − and, in our case, images and the results of image processing − is that the processes being applied to the images are transparent. People can figure out what is being done by looking at the source code. Also, making the source code available increases the likelihood that software to do the same kind of processing will be available in the future. It isn’t a guarantee, but it increases the chances for long-term reuse. Finally, open source benefits the community of people all working in a particular area, because other researchers, students, and community members can add features, fix errors, and customize for special uses. With a “copyleft” license, like the Gnu General Public License that we use, all modifications and additions to the software have to be released under this same license. This ensures that when others build on the software, their modifications and additions will be “open” as well, so that the whole community benefits. (This is a generalization of the terms; read more if you want to understand the details of a particular license.)

Open source is a licensing model for software, nothing more. The fact that it is “open” tells you nothing about the quality of the software, whether it will meet your needs, whether anyone is still working on it, how difficult or easy to learn and use it is, and many other questions you should think about when choosing technology. The initial cost of software is only one consideration in adopting a technology strategy. For example, what will it cost to switch to another solution, if this one no longer does what you need? Will you be left with a lot of files in a proprietary format that other software can’t open or use?
That leads me to remark on a related issue– open file formats. Whether you choose to use commercial software or open source software, you should think about how your data and resulting files will be stored and used. Almost always, you should choose open formats (like JPEG, PDF, and TIFF) because that means that any software or application is allowed to read and write to the format, which protects the reuse of the data in the long term. Proprietary formats (like camera RAW files and Adobe PSD files) may not be usable in the future. The Library of Congress Sustainability of Digital Formats web site has great information about this topic.
At Cultural Heritage Imaging, we use an open source model for development of imaging software because it helps foster collaboration. It also provides transparency as well as a higher likelihood that the technology and resulting files will be usable in the future. If you want to learn more about our approach to the longevity and reuse of imaging data, read about the Digital Lab Notebook.
Filed under: Guest Blogger, Technology, Training | Tags: 3D data, conservation, photogrammetry, Training
Our guest blogger, Emily B. Frank, is currently pursuing a Joint MS in Conservation of Historic and Artistic Works and MA in History of Art at New York University, Institute of Fine Arts. Thank you, Emily!
I’ve been following the development and improvement of photogrammetry software for the past few years. As an objects conservation student with a growing interest in the role of digital imaging tools in the study and conservation of art, I’ve always found photogrammetry of theoretical interest. In my opinion, until recently the limited accuracy of the software and tools impeded widespread applications in conservation. With recent advances, this is no longer the case; sub 1/10th mm accuracy has changed the game.
This January, the stars aligned and I was able (and lucky) to participate in CHI’s January photogrammetry training. From January 11 to 14, I lived and breathed photogrammetry in CHI’s San Francisco studio. The four-day course was co-instructed by Carla Schroer, Mark Mudge, and Marlin Lum, who each brought something extraordinary to the experience.
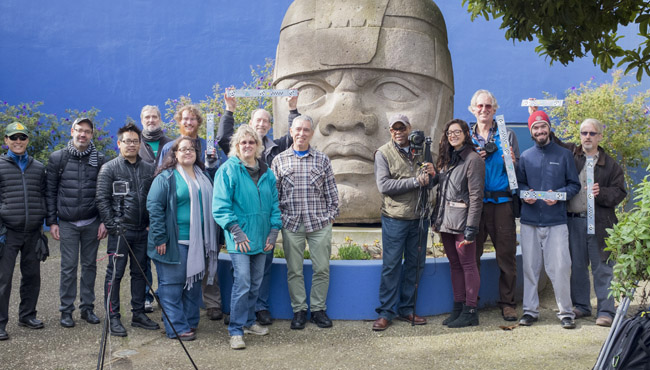
CHI’s January 2016 photogrammetry class: blogger Emily Frank is fourth from the right.
For those of you that don’t know them personally, I’ll provide context; these guys are total gurus. Carla brings business and tech know-how from years of work in Silicon Valley earlier in her career. She has a warm and direct teaching style that is accessible no matter what your photography/imaging background. Mark is a true visionary; he is rigorous and inventive, and always carefully pushing the brink of what’s possible. Marlin is the photographer of the group and a master at fabricating the perfect tool/workstation for the capture of near-perfect source images. His never-ending positivity is contagious. Together they are practically unstoppable. It’s obvious that they love teaching and truly believe in the power of the tools they are sharing.
The class began with a brief theoretical introduction, then dove into practical aspects of capture and processing. We swiftly covered how to approach a range of situations, what equipment to use, where to compromise, and where to stick to a specific protocol, etc. We focused on methodology, and we practiced a lot. We moved through capture and processing of increasingly complex projects, and we received detailed handouts to supplement everything we were learning. The class also afforded students the opportunity to work on a larger group project; this January we captured a 3D model of a reproduction colossal Olmec head located outdoors at City College of San Francisco. CHI focuses on repeatability and process in order to achieve a robust, reproducible result.

Setting up for image capture at the January 2016 photogrammetry class; blogger Emily Frank is far left.
An added benefit of the class was the insight gained through conversation with the other students, who included museum photographers, landscape photographers, archaeologists, classicists, 3D-imaging academics, and the founder of a virtual reality start-up. This diversity fostered a breeding ground for inventive implementation, and the inevitable collaboration left me envisioning new ways to employ photogrammetry as a tool in my work.
For those of you who have ever considered the use of photogrammetry, I would strongly encourage you to sign up for one of CHI’s upcoming trainings. I still have a lot to learn and master, but I left the training with the feeling that with practice I would be able to capture and process 3D data with the accuracy and resolution to meaningfully contribute to the academic study of works of art.
Notes from CHI:
- Emily Frank has included a link to a 3D model of a reproduction colossal Olmec head located at City College of San Francisco. This huge outdoor sculpture was a practice subject in CHI’s January photogrammetry class in which our guest blogger Emily Frank was a participant. The model was created with photogrammetry, and it is presented on Sketchfab, a website for 3D models.
- See our Flickr photo album of the January 2016 photogrammetry class in which blogger Emily Frank participated.
Filed under: Guest Blogger, On Location, Technology | Tags: Archaeology, biofilm removal, bronze, Lydia, Roman, RTI, Sardis
Our guest blogger, Emily B. Frank, is a student conservator on the Sardis Archaeological Expedition. Currently she is pursuing a Joint MS in Conservation of Historic and Artistic Works and MA in History of Art at New York University, Institute of Fine Arts. Thank you, Emily!
Sardis, the capital city of the Lydian empire in the seventh and sixth centuries BC, is often best remembered for the invention of coinage. Remains of a monumental temple of Artemis, begun during the Hellenistic period and never finished, still stand tall today. In Roman times, the city was famous as one of the Seven Churches of Asia in the Book of Revelation. In the fourth and fifth centuries AD, Sardis boasted what is still the largest known synagogue in antiquity. Sardis flourished and continued to grow in the Late Roman period until its decline by the seventh century AD.
Archaeological excavations at Sardis began over a century ago and are currently led by Dr. Nicholas D. Cahill, professor of Art History at the University of Wisconsin, Madison. The excavated material is vastly diverse and the conservation efforts there equally so. Conservation this season, under Harral DeBauche, a third-year conservation student at New York University, Institute of Fine Arts, supported active excavation across over 1,000 years of antiquity and addressed a number of site preservation issues. RTI greatly benefited the conservators and archaeologists in a couple of significant ways.
Significant finds with extremely shallow incised designs/inscriptions and impressions were made legible with RTI. RTI was helpful in understanding a bronze triangle recovered from the corridor of a Late Roman house (Fig. 1).

Figure 1: H-RTI setup used for small objects at Sardis.
The triangle is incised with three images of a female deity and a border of magical signs (Fig. 2). Its use is likely connected with religious ritual practice in Asia Minor between the third and sixth centuries AD.

Figure 2: RTI of the bronze triangle in cumulative unsharp masking viewing mode.
The legibility of the inscriptions, aided by RTI, reinforced the connection between the triangle’s inscriptions and material and written sources. Two comparenda for the triangle, one from Pergamon and one from Apamea, were identified, and the magic symbols on the triangle were connected with rituals described in a the Greek Magical Papyri. RTI also aided in decoding and documenting a lead curse tablet and in understanding the weave structure of bitumen basketry impressions.
Additionally, a multi-year biofilm removal project of the Artemis Temple at Sardis is currently underway, headed by Michael Morris and Hiroko Kariya, conservators in private practice. The removal of this biofilm is carried out by a six-day process. RTI was used experimentally to document the changes to the stone throughout the removal process (Fig. 3).

Figure 3: H-RTI setup used for documentation of the biocide removal project.
RTIs were taken before treatment, during treatment (day 3), and after treatment (day 7). Because the biocide continues to work for months after its application, a final RTI will be taken next summer. Initial comparison of the images showed no loss to the stone surface as a result of the biofilm removal process. All very exciting!
To find out more about the excavations at Sardis, see http://sardisexpedition.org/.
Filed under: Equipment, Guest Blogger, Lighting, Technology | Tags: capture, guest blogger, paste print, Reflectance transformation imaging (RTI), RTIViewer, specular enhancement
Our guest blogger is Dr. Lothar Schmitt, a post-doc in the Digital Humanities Lab at University of Basel in Switzerland. Thank you, Lothar!
For some people early prints are a boring topic, but a few specialists appreciate these crude woodcuts and engravings with their stiffly rendered religious subjects. There are reasons for this unusual predilection: Beginning in about 1400, prints became an increasingly important means to make images affordable for the general public. In addition, printing images stimulated the development of several technical innovations. Among these are ways to reproduce three-dimensional surfaces and to imitate the appearance of precious materials like gold reliefs or brocade textiles.
One such technique is called “paste print.”

Detail of a 15th-century paste print with numbered areas to denote materials used and damage.
With only about 200 examples existing worldwide, this kind of print is rare. It consists of a layer of a slowly hardening oil-based material (Fig. 1, No. 3) that was covered with a tin foil and brushed with a yellowish glaze in order to look like leaf gold (Fig. 1, No. 4). All these layers were stuck to a sheet of paper (Fig. 1, No. 1). To produce an image, the surface of an engraved metal plate was coated with printing ink and pressed into the paste. Through this process, the printing ink was transferred as a dark background (Fig. 1, No. 5), while the cut image of the metal plate generated a relief of golden contours and hatchings. Since these layers became brittle over time, most paste prints are heavily damaged (Fig. 1, No. 2). Moreover, the subjects they show are sometimes hard to decipher.
Traditional photographs are not well suited to reproduce paste prints because it is impossible to record the interaction between the light and the barely discernible relief of the print’s surface with one single capture. To document such effects, our team, a Swiss National Science Foundation (SNSF) research group of four people at the Digital Humanities Lab in Basel, Switzerland, made the decision to try Reflectance Transformation Imaging (RTI). The benefits of RTI are ideal for revealing the material properties of the prints. However, since RTI is not able to properly reproduce the gloss of a metal surface, we were unsure about the results. The first test was very promising.
We traveled from Basel to nearby Zürich, where there is a paste print of an unidentified saint glued into a manuscript at the Zentralbibliothek Zürich (B 245, fol. 6r). The library staff, among them Rainer Walter and Henrik Rörig, were very helpful. Peter Moerkerk, head of the digitization center, even made a high-resolution scan of this print that we could use as a reference image (Fig. 2).

Fig. 2: High-resolution scan of a paste print of an unidentified saint from manuscript B 245 in the Zentralbibliothek Zürich.
For capturing RTIs we constructed a Styrofoam hemisphere with a diameter of 80 cm. On the inside of the hemisphere, there are 58 evenly distributed LEDs that can be triggered in succession. The LEDs are synchronized via a simple control unit that is connected with the flash sync port of the camera. The control unit coordinates with the interval mode of the camera in order to capture a sequence of images automatically. The resulting RTI file shows the subtle surface texture and is instrumental for comprehending the relief and the layered structure of the print (Fig. 3).

Fig. 3: RTI of a detail of the print in Fig. 2, showing surface texture and layered structure.
As we pointed out earlier, the glossy effects of the golden parts appear too dull, but the “specular enhancement” feature of the RTIViewer helps to distinguish between the surface conditions of the different materials that were employed to make the print.
RTIs of two other paste prints in Switzerland and several others in German collections will be captured in 2015 and 2016. If you are interested in our proceedings, please see our web site: http://dhlab.unibas.ch/?research/digital-materiality.html
Filed under: Commentary, Guest Blogger, Lighting, On Location, Technology | Tags: capture, guest blogger, medieval, mosaic, Preservation, PTM, Reflectance transformation imaging (RTI), tesserae
Our guest blogger is Heidrun Feldmann, a PhD student in History of Art at the University of Basel and an assistant on the research project “Digital Materiality” at the Digital Humanities Lab there. Thank you, Heidrun!
It is obvious that art historians need good reproductions of works of art to do their research. However, photographic images, which are static and two-dimensional, are not capable of reproducing the visual impression we have when we look at mosaics. Their specific materiality and surface properties make a visualization of these characteristics difficult. Besides, as ancient or medieval mosaics are usually placed on the walls of churches, they interact with those specific surroundings. The lighting conditions inside these buildings, as well as the optical impressions for a visitor moving across the room, change dynamically, which results in a unique sensory experience. This is also a reason why the designs of mosaics in such religious contexts were often attuned to the liturgy. The impressive sparkling effect is caused by the surface properties of the countless tesserae, which – when animated by light − shimmer in many different colours and shine like precious metals. Sometimes those tesserae were placed in the setting bed with a certain tilt angle. This might seem irregular to us today, but then it was done intentionally to optimize the reflectivity of the surface.
With the aid of RTI (Reflectance Transformation Imaging), we now have more options for capturing and simulating the reflection properties of a mosaic’s surface, as well as its interaction with changing light conditions. The RTIViewer software enables us to convey the impressions of this highly dynamic medium to people who cannot visit the actual mosaic in situ. RTIs also help us document the current condition of mosaics more accurately than in the past, and they support our goal to answer questions about how light was used in medieval architecture.
To test the RTI method, we visited the Bode-Museum in Berlin, where a mosaic, originating from the church of San Michele in Africisco, Ravenna, is exhibited as part of the Early Christian and Byzantine Collection (Figure 1). We thank Gabriele Mietke, curator of the department, for allowing us to take our photos. The mosaic is fitted into the architecture of the museum, where an apse was constructed to imitate the original place of its installation in the church in Ravenna, albeit without the original lighting situation.

Figure 1: The team of the Digital Humanities Lab taking photographs of the mosaic at the Bode-Museum, Berlin.
Scholars have extensively debated the condition and state of preservation of this mosaic. Without going into all the details, we can say it is certain that the mosaic we see in the museum differs from the original of 545 AD because of its turbulent history. It has been restored and changed more than once, and some critics say that the whole mosaic is merely a copy. For us this was particularly interesting. We were wondering if the RTIs would provide further information regarding interventions, changes, or repairs.
Because of its size and form, it was impossible to take pictures that cover the whole of the apse. Therefore we captured it in twelve segments. About sixty photographs were taken of each of these segments, changing the position of the flashlight by hand for every picture. The twelve RTI files we obtained in this way show the reflection properties much better than any static photograph could do.

Figure 2: RTI image of the head of Christ in a detail from the mosaic.

Figure 3: Same detail of the mosaic with light from a different direction.
There are some limitations with glossy surfaces, because specular reflection cannot be adequately represented with the typical mathematical model used in Polynomial Texture Maps (the first form of RTI). However, changing the angle of the incoming light in the RTIViewer software allows us to identify areas whose structure and reflection properties differ from the others. In those areas the tesserae are of a different size or form and seem to be set in another way. All this suggests that these are the areas where the mosaic has undergone some kind of repair or restoration (Figures 2 and 3).
Having successfully tested the technique under the special conditions in the museum, we are now looking forward to the next step: capturing RTIs of medieval mosaics in situ and working on enhanced models for the visualization of gloss.
To find out more about our research project, see http://www.dhlab.unibas.ch.
Filed under: Commentary, Guest Blogger, News, On Location, Technology | Tags: ancient footprints, photogrammetry, Preservation
Sarah Duffy, PhD is a Postdoctoral Research Associate at the University of York in the Department of Archaeology. In May of 2013, after a series of storms, ancient footprints were revealed on a beach near Happisburgh (pronounced “Hays-boro”) on Britain’s east coast in Norfolk (see a 6-minute video). The footprints were fragile and washing away a little day by day. Sarah was called to the site by Dr. Nick Ashton, Curator of Palaeolithic and Mesolithic collections at the British Museum, to document it. Here is our interview with Sarah about this dramatic discovery.

Sarah shooting photogrammetry in the rain. Image courtesy of Natural History Museum, London, UK
CHI: Sarah, can you tell us how you got involved in the project and what you found when you arrived?
Sarah: It really came down to good timing and an opportune meeting of research colleagues. When the footprints were discovered, I had just begun working with Dr. Beccy Scott at the British Museum on a project based in Jersey called “Ice Age Island”. Beccy and my partner, Dr. Ed Blinkhorn, another early prehistoric archaeologist, have collaborated for many years, and he introduced us. During the week of the discovery, Beccy happened to be at a research meeting with Dr. Nick Ashton and suggested that he get in touch with me about the Happisburgh finding.
The next day, I received a call from Nick who asked if I would be able to take a trip to Norfolk to record some intertidal Pleistocene deposits at Happisburgh. Having just completed my PhD thesis (a “dissertation” in US currency), I was up for an adventure and ready to take on the challenge, and so I was on a train to the southeast coast two days later.
My first plan of action was to figure out how on earth you pronounced the name of the site! The next step was to figure out what equipment I would need to have available when I arrived. This proved somewhat challenging, as I had never visited the Norfolk coast, and it seems quite humorous in hindsight that one of the pieces of kit I requested was a ladder.
All of this said, the urgency to get the site photographed became clear when I showed up one very rainy afternoon in March. Standing on the shore, I felt very privileged to have been invited to record such an important set of features, which disappeared within only weeks of their discovery by Dr. Martin Bates.
CHI: What were your goals in the project and why did you choose to shoot images for photogrammetry? Can you tell us a little bit about your approach?
Sarah: Since I wasn’t sure what to expect when I reached the site, I took both photogrammetric and RTI kit materials with me. I intended to capture the 3D geometry of the prints with photogrammetry and subtle surface relief with RTI. However, when I arrived, both the weather and tidal restrictions limited the time we were able dedicate to recording. I therefore focused my efforts on photogrammetry, which proved a flexible and robust enough technique that we were able to get the kit down the cliff side in extremely challenging conditions and capture images that were used later to generate 3D models.
Based on the looming return of the tide and the amount of time required to prepare the site, our window of access was quite small. While I took the images, aided by Craig Williams and an umbrella, the rest of the team battled the rain and tide by carefully sponging water from the base of the features. As mentioned, I originally intended to capture images from above the site using a ladder. However, as the ladder immediately sank into the wet sand, I was forced to find other means of overhead capture: namely Live View, an outstretched arm, and umbrella. There was just enough time to photograph the prints, loosely divided into two sections, using this recording approach before we had to retreat back up to the top of the cliff (and to a very warm pub for a much deserved fireside pint!).

3D model of laminated surface containing the footprints at Happisburgh. Photo by Sarah M. Duffy
CHI: When you got back to your office, how long did it take you to process the images, and what software did you use?
Sarah: Originally, I used the Standard Edition of PhotoScan by Agisoft, later returning to the image set in order to reprocess it with their Professional Edition. PhotoScan’s processing workflow is relatively straightforward, and the time required to generate geometry is somewhat dependent on the hardware one has access to. The post-processing of the images was by far the most time-consuming component of the processing sequence. Since the software looks for patterns of features, there was a substantial amount of image preparation that needed to be completed first, before models could be produced. For example, rain droplets on the laminated surface that contained the prints needed to be masked out, as well as the contemporary boot prints that accumulated in the sand that surrounded the site throughout the image sequence.
CHI: How were the 3D models you produced used by the other archaeologists involved with the site?
Sarah: Once the models had been generated, the rest of the team, including Nick Ashton, Simon Lewis, Isabelle De Groote, Martin Bates, Richard Bates, Peter Hoare, Mark Lewis, Simon Parfitt, Sylvia Peglar, Craig Williams, and Chris Stringer, wrote the paper on the results. Nick Ashton and Isabelle De Groote closely analyzed the models of the prints in order to study size, movement, direction, and possible age of the early humans who might have created these features. Isabelle later worked with the 3D printing department at Liverpool John Moores University in order to have one of the digital models printed.
CHI: Since the footprints were washed away, your images are the best record of the site that exists. Are the 3D models accessible? What will you do to preserve this material?
Sarah: Coverage of the footprints, including excerpts of the digital models that I generated and the 3D printout, can be viewed at the Natural History Museum exhibit in London, Britain: One Million Years of the Human Story, which closes September 28th. Findings from the analysis have also been published in PLOS ONE, an open-access, peer-reviewed scientific journal.
As mentioned, when I visited the site last March, I had hoped to undertake a RTI survey. Although conditions on the day of recording did not permit multi-light capture, I have since been able to generate virtual RTI models that reveal the subtle topography of the prints. An excerpt of one of these models can be viewed on my website.
Additionally, the research team, in collaboration with the Institute of Ageing and Chronic Disease at Liverpool, are currently working on extracting further information from the image set. Findings from this work will be made available in the future. Once analysis is complete, the images and resulting models will be archived with the British Museum.
CHI: Thank you for your time, Sarah, and what a great story!
Sarah Duffy has been collaborating with Cultural Heritage Imaging (CHI), including taking CHI’s training in Reflectance Transformation Imaging (RTI) and working with the technique since 2007 while she was a graduate student in Historic Preservation at the University of Texas at Austin. Sarah authored a set of guidelines for English Heritage on RTI. During her doctoral work, she also began to apply her imaging skills in the area of photogrammetry.
I have had the good fortune to attend a few recent events that allowed me to see some really useful work other folks are doing in our field. I thought it worth a blog post to mention a few with some links. I’ll note that I have seen even more cool stuff, but if there wasn’t a paper or a page I could link to, I decided not to include it here.
First, Mark Mudge and I were at Computer Applications and Quantitative Methods in Archaeology (CAA) in late April in Paris. Yes, I know, it is a hard-knock life having to present your work in Paris in April. I always love CAA because it is a great conference for sharing information and real-life experiences. People are super helpful, and everyone wants to see everyone else succeed. This isn’t the norm for a lot of conferences.

Musee de Cluny, Paris
I want to point out 2 projects from there. The first is Eleni Kotoula’s RTI on Papyrus case study. New here is Eleni’s use of multispectral imaging and also her experiment with transmitted RTI. Eleni was interested in information for conservation about the state of this papyrus, which is mounted on cloth and under glass. The second project at CAA isn’t an RTI project, but it’s very cool and worth mentioning anyway. It is the work of Adam Rabinowitz et al. on PeriodO. As folks who follow our efforts know, we at CHI are big fans of metadata, process-history tracking, and related topics. Figuring out how to talk about periods in archaeology and art is really hard, and Adam and team have an idea for an interesting approach. This project recently won National Endowment for the Humanities support, so it will be able to go forward. You can and should contribute to this effort yourself!
Next up is the American Institute for Artistic and Historic Works (AIC) conference, which took place at the end of May, right here in San Francisco. It was great for us to have so many folks we have worked with here in SF. One of the things I noticed at this conference was that Reflectance Transformation Imaging (RTI) showed up in a number of talks, though that wasn’t the focus of the talk. RTI is another tool to look at objects people are studying, and RTIs are being shown right alongside IR images and X-rays and the like. YAY! My takeaway is that RTI is an accepted part of the practice for art conservators. We are super happy to see that.
Finally, I was able to attend a 3-day workshop on RTI current practice and future directions, hosted by the Cyprus Institute in Nicosia, Cyprus in early June. This was “All RTI, All the Time!” and it was very productive to be part of a dedicated meeting like this. There were many noteworthy projects presented there, and I’ll point out a few. Up first, the work of Todd Hanneken and others integrating spectral imaging and RTI. While many of us have done spectral imaging and RTI going back several years, what is new here is the use of a MegaVision monochrome camera system, and taking 11 spectral bands. RTI was shot in the visible and used for luminance data to generate the RTIs, and the color data collected via the spectral bands was then applied to the images shot in visible light. The team also tested shooting full RTIs in each spectral band for comparison. In addition, work from the Visual Computing Lab in Pisa for a WebGL-based RTI viewer, released in January of this year, was discussed. At the moment, this work is limited to streaming large RTI files and then allowing the user to pan, zoom, and relight, but some possible future directions were outlined. It is open source, so you can try it out yourself. There is also a project at The University of Southampton to develop a web-based RTI viewer, and we received an update on that project, but I don’t have a link where I can send you just yet.

RTI group in the old city of Nicosia
As part of the discussion on where RTI is going, there was a lot of interest in quantitative uses of RGB and normals data. There are a variety of people working in this area, though they didn’t present directly at any of these meetings. Several of these folks are working with us at CHI, and we are very excited by this direction. First up, the work of Dale Kronkright, Greg Bearman, and several others to look at tracking changes through normals, and also to quantify normal calibration. You can find both papers here. Additionally, there is great work going on at Simon Fraser University under Professor Mark Drew to improve the accuracy of surface normals calculated from RTI data sets. They are also working on improving the appearance of RTI data in the viewing environment. There are a number of papers on this topic, most recently the masters thesis of Mingjing Zhang.
It is an exciting time to be working with RTI data! There is much more work going on than I could include here, and more that hasn’t been published yet. I want to close with a plug for the CHIForums where many topics like this are discussed, and there is a Projects Forum where folks can put up links to their work, as well as get comments and feedback.
